
Spray Charts
See Where Every Batted Ball Lands—Automatically
Traditional pitch charts show what was thrown. Spray charts show what happened after contact. Pitch MetRx plots every ball in play on an interactive field diagram—color-coded by contact quality and linked to the pitch type, location, count, and batter hand that produced it. Chart live from the dugout and review spray patterns mid-game or post-game, with filters that answer the questions coaches actually ask.
What Pitch MetRx spray charts show you
Open the Spray Chart tab from post-game reports, mid-game reports, lifetime statistics, or custom date-range reports. Every ball in play you logged during the game appears on a field diagram—ready to filter and analyze.
Contact quality at a glance
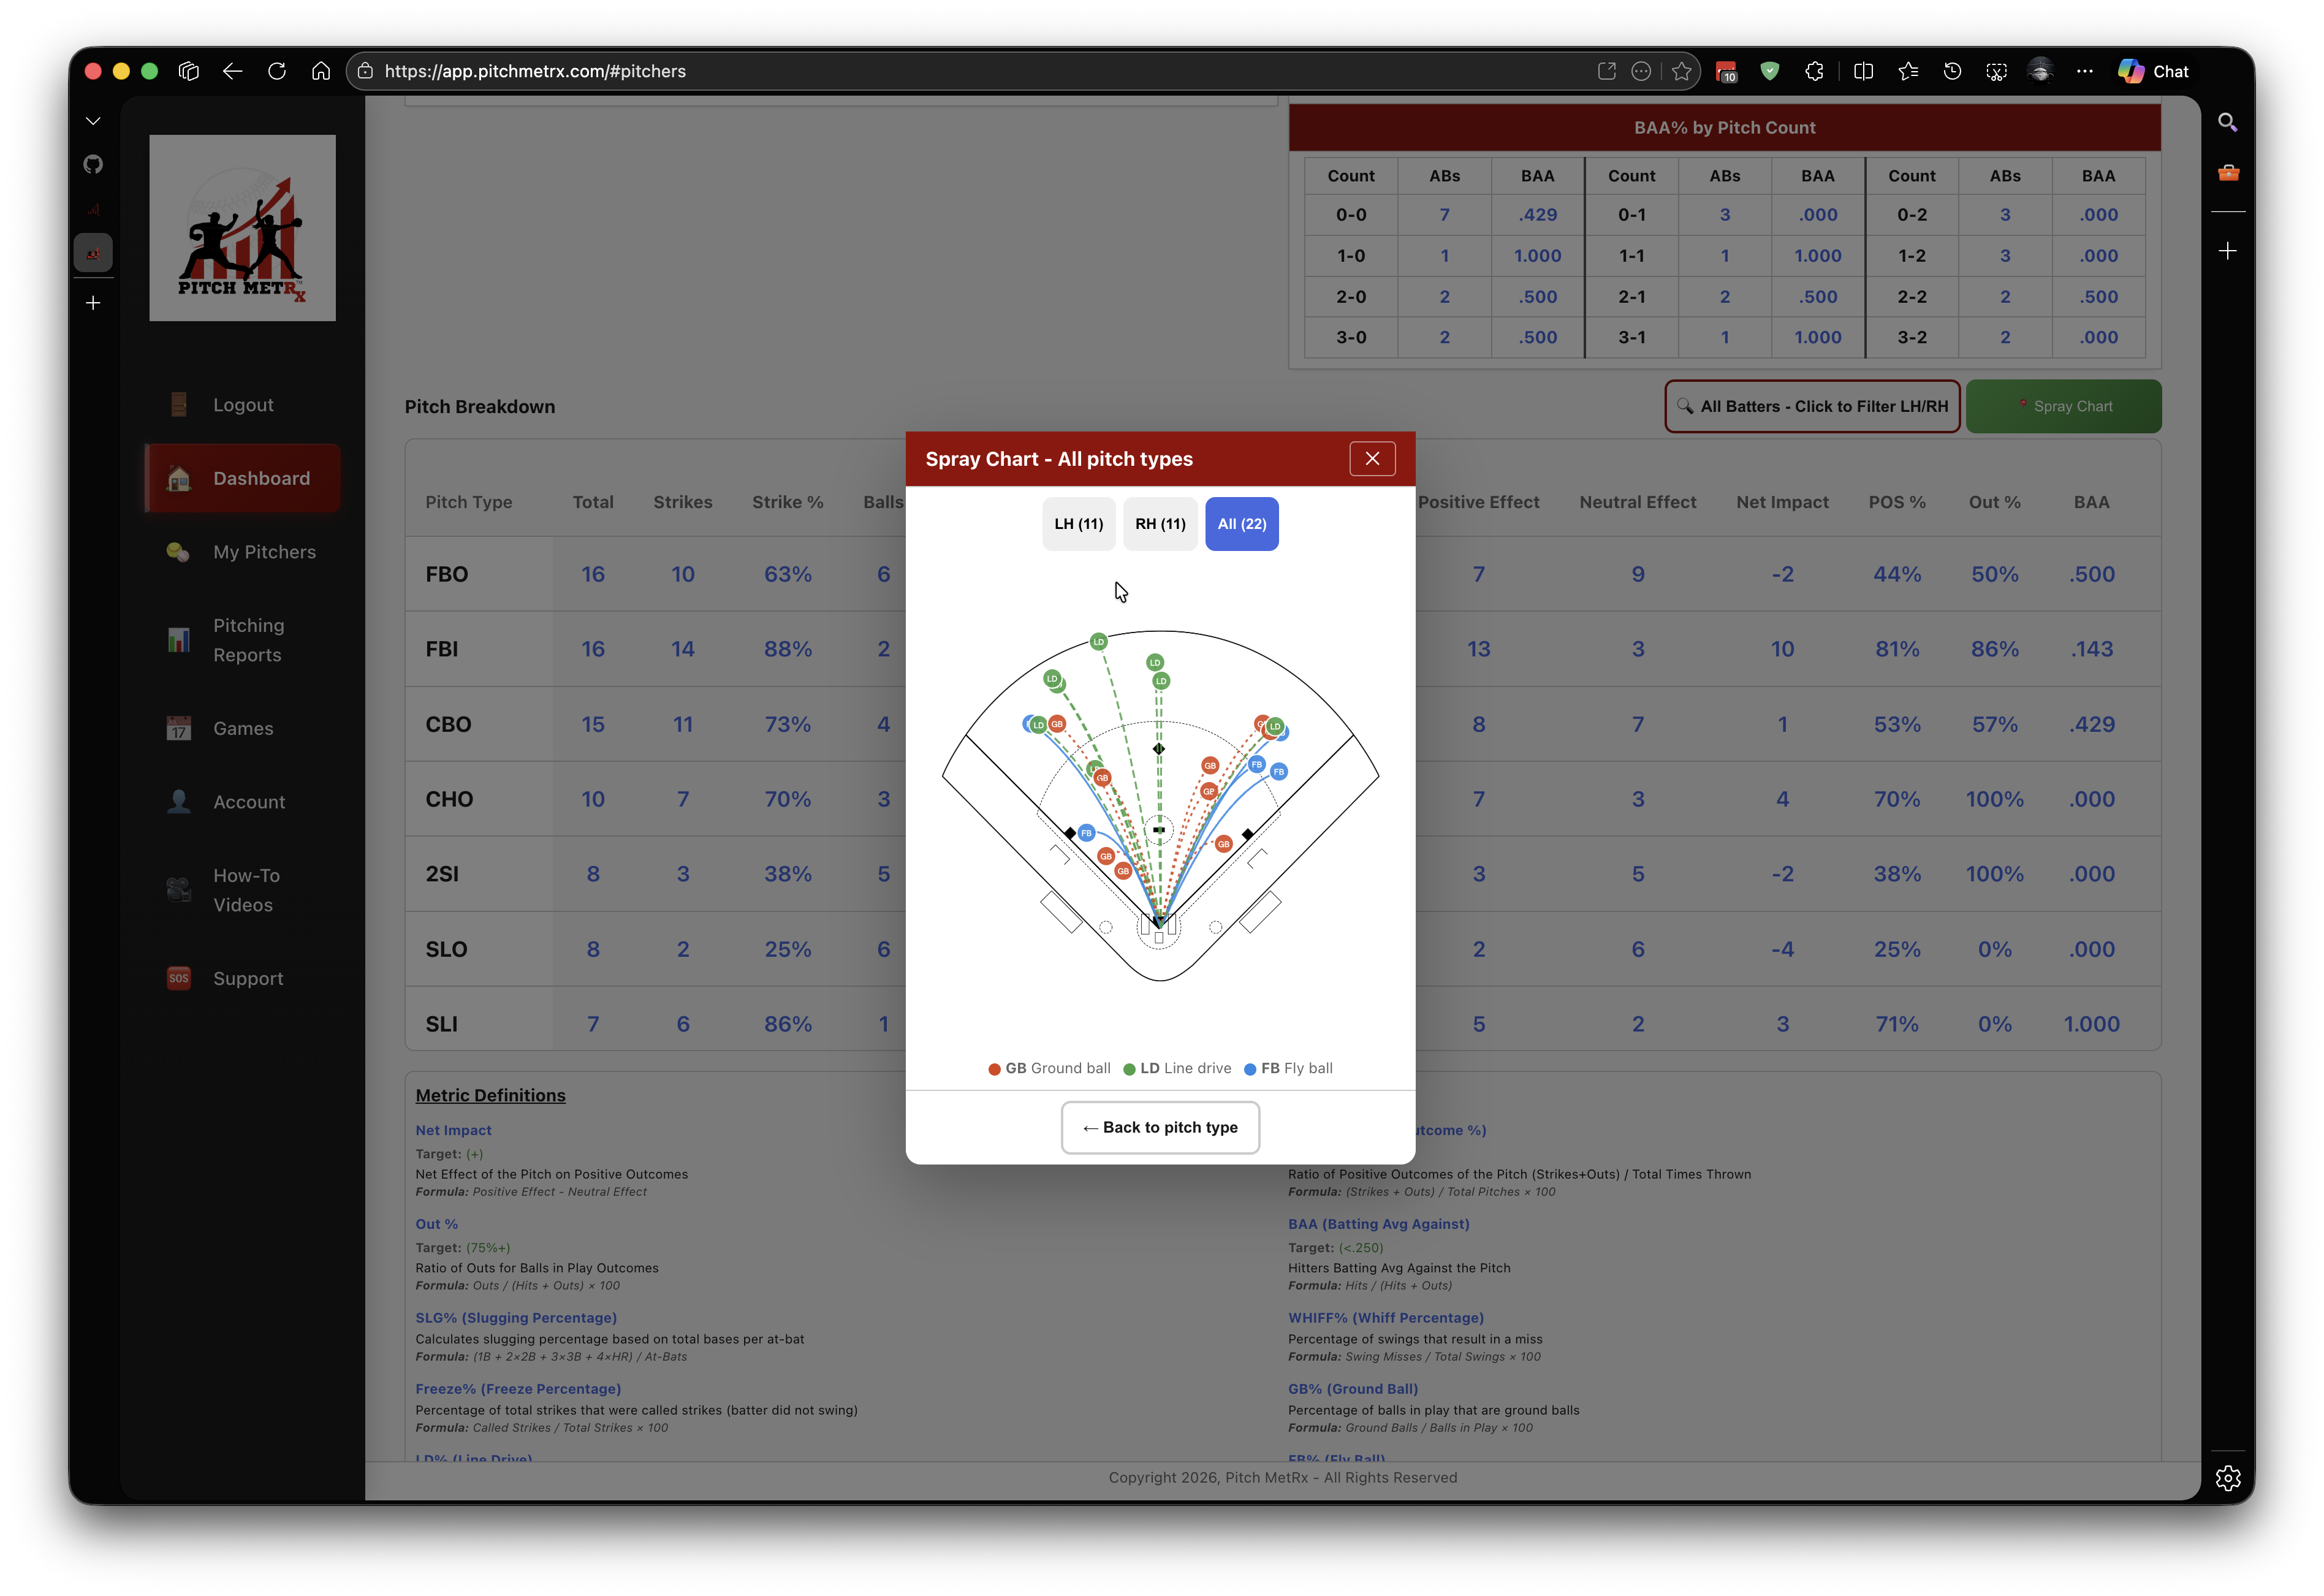
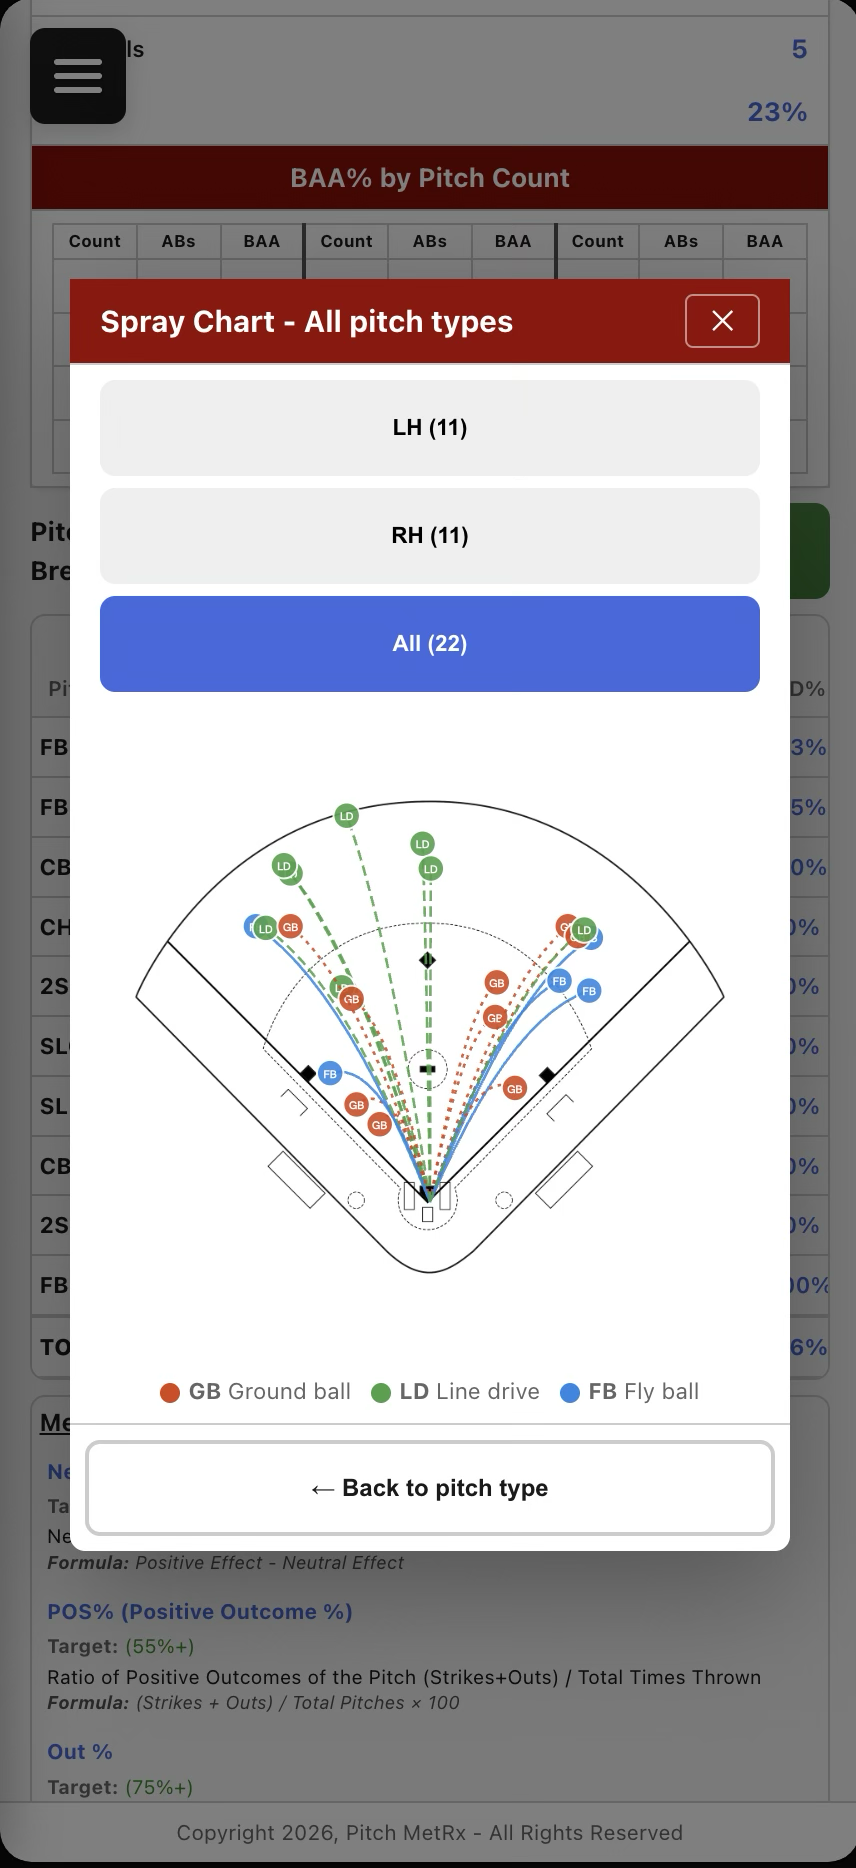
Color-coded markers distinguish ground balls, line drives, fly balls, and hits—so you spot hard contact vs. weak contact without reading a spreadsheet.
Filter by batter handedness
View all batters, left-handed hitters only, or right-handed hitters only. See whether your fastball gets pulled by RH batters or driven the other way by LH batters.
Drill down by pitch type
Tap into individual pitch types to see where each specific pitch tends to get hit—fastball vs. changeup vs. rise vs. drop, each with its own spray pattern.
Linked to your pitch log
Every dot on the chart ties back to the pitch type, location, count, and outcome you logged live—full context for every batted ball.
Mid-game and post-game
Review spray patterns between innings when something feels off, or run a full post-game debrief while details are still fresh.
Season-long trends
Run custom date-range reports to compare spray charts from early season to now—proof of development for pitchers, parents, and staff meetings.
From subjective feel to objective contact data
Every coach has watched a pitcher throw what feels like a great pitch—only to see the ball barreled or find a hole. ERA and strikeouts do not tell that story. Spray charts do.
Modern pitching is about contact management. Spray charts help coaches answer questions that change games:
Hot zones
Which pitches are producing weak contact—and where on the field? Shift your defense or adjust targets before the next inning.
Pull vs. oppo
Are hitters pulling your fastball or going the other way? Spray patterns reveal tendencies your memory will miss after a long doubleheader.
Pitch-type effectiveness
Is your breaking ball generating ground balls or fly balls? Filter by pitch type and see the contact profile for each weapon in the arsenal.
Defensive alignment
Show infielders exactly where balls are being put in play. Why shift if the data shows almost nothing up the middle?
Pair spray charts with Pitch Call Analysis to connect what you called with where contact happened—and build sequencing plans grounded in both intent and outcome.
See spray charts in action
The spray chart view plots every batted ball on a full field diagram. Filter by handedness, drill into pitch types, and review from any device—laptop in the press box or phone in the dugout.


How spray charts work in Pitch MetRx
- Chart live from the dugout — log pitch type, location, outcome, and batter hand on every throw.
- Mark the spray chart — when a ball is put in play, tap where it landed on the interactive field diagram.
- Open the Spray Chart tab from any report—mid-game or post-game—to see every batted ball plotted automatically.
- Filter by LH or RH batters to build separate defensive and pitch-calling plans for each matchup.
- Drill into pitch types to see where each specific pitch gets hit—fastball inside vs. outside, rise vs. drop, and more.
- Export PDF or CSV for staff meetings, defensive prep, or parent conversations.
Frequently asked questions
What is a spray chart?
A spray chart plots every ball in play on a field diagram. Each mark shows where contact happened and what kind of contact it was—ground ball, line drive, fly ball, or hit. Combined with pitch type and location data, spray charts reveal which pitches produce weak contact and where hitters tend to drive the ball.
How are spray charts different from pitch charts?
Traditional pitch charts focus on what the pitcher threw and where. Spray charts focus on what happened after contact—giving you the missing piece for pitch effectiveness and defensive positioning.
Do I need a separate subscription for spray charts?
No. Spray charts are included with every Pitch MetRx subscription. Start a 14-day free trial, chart a game, and open the Spray Chart tab from your first report.
Can I use spray charts for baseball and softball?
Yes. Pitch MetRx supports both sports with sport-specific pitch types and field diagrams. The same live-logging workflow generates spray charts for either program.
Do I need TrackMan, Rapsodo, or other hardware?
No. Spray charts are built from outcome data you collect with a phone or tablet during live games. No radar guns, cameras, or proprietary hardware required.
Stop guessing where balls are being hit
Join programs at UCLA, Williams College, Capistrano Valley, and travel ball nationwide who use Pitch MetRx for data-driven pitch calling and contact management.
Start 14-Day Free Trial